SSC CGL Tier 1
Venn Diagram
Venn Diagram is a topic where circles are used to show the relationship between different groups. You have to find how many members belong to one group, both groups, or neither group. It is a visual and logical topic that is very easy once you understand the basic concepts.
What is a Venn Diagram?
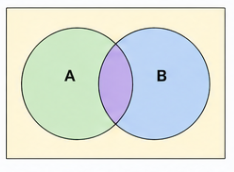
A Venn Diagram uses overlapping circles to show relationships between groups.
- The part inside only Circle A = members belonging to only Group A
- The part inside only Circle B = members belonging to only Group B
- The overlapping part = members belonging to BOTH Group A and Group B
- The part outside both circles = members belonging to NEITHER group
Types of Venn Diagram Questions in SSC CGL:
Type 1 - Relationship Between Three Items Three items are given and you have to find which Venn diagram best represents their relationship.
Example 1:
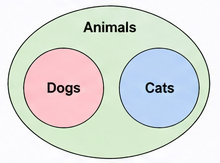
Which diagram represents: Dogs, Animals, Cats?
Logic:
- All dogs are animals
- All cats are animals
- No dog is a cat
Example 2:
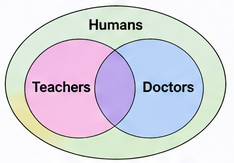
Which diagram represents: Teachers, Doctors, Humans?
Logic:
- All teachers are humans
- All doctors are humans
- Some teachers may also be doctors
Example 3:
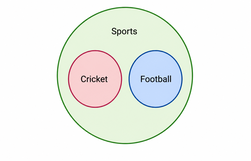
Which diagram represents: Cricket, Football, Sports?
Logic:
- Cricket is a sport
- Football is a sport
- Cricket and Football are different sports
Type 2 - Data Based Venn Diagram Numbers are given in different parts of circles and you have to calculate totals.
Example:
In a class of 50 students:
- 30 students like Cricket
- 25 students like Football
- 10 students like both Cricket and Football
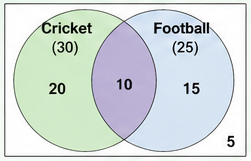
Questions that can be asked:
- How many like only Cricket? = 30 - 10 = 20
- How many like only Football? = 25 - 10 = 15
- How many like at least one sport? = 20 + 15 + 10 = 45
- How many like neither? = 50 - 45 = 5
Important Formula:
n(A ∪ B) = n(A) + n(B) - n(A ∩ B)
Where:
- n(A ∪ B) = Total who like at least one
- n(A) = Total in Group A
- n(B) = Total in Group B
- n(A ∩ B) = Total in both groups
Type 3 - Three Circle Venn Diagram Three groups are given with overlapping data.
Example:
In a group of 100 people:
- 40 know Hindi
- 35 know English
- 30 know Tamil
- 10 know Hindi and English both
- 8 know English and Tamil both
- 6 know Hindi and Tamil both
- 3 know all three languages
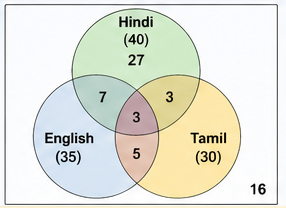
Questions:
- How many know only Hindi? = 40 - 10 - 6 + 3 = 27
- How many know at least one language? = 40 + 35 + 30 - 10 - 8 - 6 + 3 = 84
- How many know none? = 100 - 84 = 16
Formula for Three Groups:
n(A ∪ B ∪ C) = n(A) + n(B) + n(C) - n(A ∩ B) - n(B ∩ C) - n(A ∩ C) + n(A ∩ B ∩ C)
Common Relationships in Type 1 Questions:
- Animal inside bigger Animal group: Dog inside Animal circle
- Two completely separate groups inside bigger group: Cricket and Football inside Sports
- Two partially overlapping groups inside bigger group: Male Doctors and Doctors inside Humans
- Completely separate groups with no connection: Sun, Moon, Stars (all separate circles)
- One inside another inside another: Villages inside Districts inside States
How to Solve Venn Diagram Questions:
Step 1 - Read all three items carefully.
Step 2 - Check if one item is a subset of another (like Dog is a subset of Animal).
Step 3 - Check if two items can overlap (like a person can be both Teacher and Doctor).
Step 4 - Check if two items are completely separate (like Cricket and Football).
Step 5 - Choose the diagram that matches all three relationships.
For Data Based Questions:
Step 1 - Write down all given values.
Step 2 - Draw a Venn diagram and fill in the overlapping part first.
Step 3 - Calculate only A = Total A minus both.
Step 4 - Calculate only B = Total B minus both.
Step 5 - Add all parts to find total.
Important Tips:
- In Type 1 questions always check if a subset relationship exists first
- Remember the formula n(A ∪ B) = n(A) + n(B) - n(A ∩ B)
- Always fill in the innermost overlapping region first in data questions
- 2 to 3 questions come from this topic in SSC CGL every year
- Practice drawing Venn diagrams for at least 10 different relationships daily